Coastal Risks: How Callendar Mapped the Future of Territories Facing Rising Seas
- Aug 26, 2025
- 5 min read
Climate change is accelerating sea-level rise and coastal erosion, threatening infrastructure, habitats, and economic activities in coastal areas worldwide. According to the IPCC’s Sixth Assessment Report, over one billion people will be exposed to coastal hazards by 2050. With rising sea levels, intensifying coastal erosion, and increasingly severe extreme weather events, coastal regions face a major and urgent challenge.
Anticipation is key: relocating populations, building protective infrastructure or elevating critical assets are decade-long projects that require planning, investment and stakeholder engagement. Yet, despite the urgency, many regions lack the accurate, granular, and forward-looking data needed to act effectively. Most existing risk assessments are either too broad, focusing on regional trends rather than local vulnerabilities, or too fragmented, treating flood, submersion, and erosion risks in isolation.
To fill this critical gap, Callendar developed and implemented a comprehensive coastal risk assessment methodology at the parcel level. This approach was successfully tested across France’s 20,000 kilometers of coastline, including mainland and overseas territories, and nearly 100 million parcels.
A Comprehensive, Science-Based Methodology
Callendar’s approach evaluates three key coastal risks and their evolution over the coming decades:
Permanent marine submersion: Land permanently lost to rising sea levels.
Temporary coastal flooding: Storm surges and extreme tides, exacerbated by sea-level rise.
Shoreline retreat: The gradual or sudden erosion of the land-sea boundary.
Unlike other climate risks (e.g., heatwaves or wildfires), coastal hazards are hyper-local. Two buildings just meters apart can face vastly different exposure depending on elevation, geology or coastal defenses. To capture this complexity, Callendar’s analysis can be conducted at any level, from regional to buildings, provided that a geometry is available. This flexibility allows for assessments across millions of locations.
For our French demonstration, we used the "parcelle cadastrale" (cadastral parcel) level, the smallest administrative land unit, with nearly 100 million individual assessments across mainland France and overseas territories.
How We Assess Permanent Submersion Risk
A parcel is at risk of permanent submersion if its elevation is below the projected sea level at high tide for a given time horizon.
The altitude of a parcel is estimated by calculating the position of its geometric center (or centroid) based on its geometry, then evaluating the altitude of this point using a Digital Elevation Model, in our case study we used high-resolution LiDAR-based altimetry data from IGN, the French national geographic institute.
The sea level at high tide is calculated by adding:
The height of astronomical tides, considered independent of climate change, and determined using historical data from Copernicus, the European Earth observatory, over a period beginning in 1951.
The average sea level, based on projections from the IPCC's 6th Assessment Report. We used the worst-case scenario: high emissions scenario (SSP5-8.5) at “low confidence level” (i.e., taking into account uncertain processes, such as a possible collapse of the Antarctic ice sheet).
This method builds on Callendar’s 2022 study of French real estate exposure to submersion, but now extends to all coastal parcels nationwide, including overseas territories, with updated climate projections.
How We Assess Temporary Coastal Flooding Risk
Even parcels above normal high-tide levels can be flooded during extreme events like storms or cyclones.
To evaluate this risk extreme sea levels are calculated by adding a storm surge (temporary sea-level rise due to storms) to the projected high-tide level.
This surge is estimated based on climate projections for the SSP5-8.5 high emissions scenario and the year 2050, corresponding to a 10-year storm tide (or a 10% annual probability).
A parcel is flaged as at-risk if its elevation falls below this extreme sea level. In concrete terms, this means that at that time horizon the location will have a 10% or higher probability of being flooded each year.
How We Assess Shoreline Retreat Risk
Long-term erosion rates are estimated in 200-meter segments along the coastline by comparing a recent shoreline position with an older known position, typically recorded between 1920 and 1951. These trends are then extrapolated into the future.
The process of identifying areas at risk of erosion involves two main steps:
Identifying eroding segments: we identify coastal segments where the erosion indicator shows a retreat. These segments represent approximately 18% of France's coastline, while the remaining coastline is either stable or advancing (about 12%).
Projecting future retreat: The observed retreat rates are then extrapolated to the desired future time horizon. For example, if a segment has been retreating at an average rate of 2 meters per year, the at-risk zone for the year 2050 (25 years from now) would extend 50 meters inland from the current shoreline.
A parcel is considered at risk of shoreline retreat if it falls within these projected risk zones.
Validation and Limitations: Ensuring Robust Results
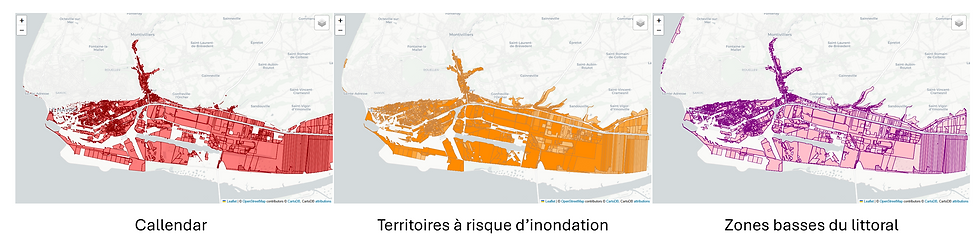
To validate our methodology, we compared our results for France with risks maps where they exist. We used to type of zoning:
"Territoire à risque d'inondation" or TRI (flood risk territories) : Detailled risk mapping but limited to the main main urbans areas, only a small fraction of the coastline is covered.
"Zone basse du littoral" (Low-lying coastal zones) : A map of areas located less than one meter above the maximum tide level, available nationwide but based on simplistic, non-climate-adjusted data.
Despite different methodologies, the results show remarkable consistency, confirming the robustness of our approach. For example, in Le Havre, the areas identified as at risk by Callendar closely matched those in official flood prevention plans:
It is worth noting that, while robust, our approach has known limitation:
Elevation precision: Centroid-based elevation may miss intra-parcel variations.
Linear erosion extrapolation: Our method assumes constant retreat rates, ignoring climate feedbacks or human interventions (e.g., seawalls).
Coastal defenses: Due to lack of data, we were not abale to account for existing protections (dikes, breakwaters...), which may reduce local risk.
From Data to Action: Empowering Coastal Adaptation
What sets this method apart is its ability to combine a very high level of detail with large-scale analysis. By optimizing computational efficiency, it enables high-resolution risk assessments across tens of millions of individual locations, such as parcels, buildings, or infrastructure, without compromising precision.
It can be used in a variety of contexts, including:
Local governments to integrate more granular risk data into adaptation plans or zoning laws.
Insurers to refine risk models for coastal properties.
Infrastructure managers to prioritize resilience investments in high-risk zones.
It can also be useful for individuals, such as those considering buying a property near the coast. We offer a free risk evaluation tool based on this methodology for this specific use case.
Coastal risks are not just a French issue, they are a global emergency. From the Netherlands to Vietnam, Florida to Fiji, coastal regions face similar challenges. This methodology demonstrates how high-resolution, science-based risk assessment can be realistically performed on whole country.
Want to assess your territory’s or assets’ exposure to coastal risks? Contact us to explore how our solutions can support your adaptation strategy.


