Mapping Wildfire Impact: Demonstration of a Scalable Methodology for Local Climate Risk Assessment
- tlaconde
- Aug 7, 2025
- 4 min read
Updated: Aug 8, 2025
As the climate warms and drought becomes more frequent, wildfires are emerging as one of the most visible and destructive consequences of global change. While fire weather indices make it possible to anticipate periods of heightened risk and long-term trends, evaluating historical wildfire incidence remains a challenge in many regions, especially where insurance systems or disaster declarations do not systematically record fires.
In France, for example, wildfire events are not covered by the national natural disaster insurance regime (CATNAT). This means they are absent from many historical risk datasets used in real estate, urban planning, or insurance. In response to this data gap, we developed a scalable, satellite-based methodology to estimate wildfire incidence at the municipal level.
This article outlines our approach, showcases results from France, and highlights the method's global potential with examples from other fire-prone regions.
A Satellite-Based Approach to Past Wildfire Risk at Local Level
Our method relies on burned area data derived from Sentinel-2 and MODIS satellite imagery, available through the European Forest Fire Information System (EFFIS). This open-access dataset covers most of Europe, North Africa, and the Middle East from 2008 to the present, updated almost in real time.
While this 17-year record is slightly shorter than the 20- or 30-year benchmarks typically used in climatology, it provides a sufficiently deep archive to assess wildfire patterns with consistency across regions.
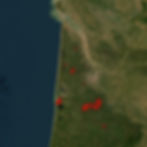
As an example, this map shows the burned areas around Bordeaux in southwest France. The scars from the large 2022 Teste-de-Buch and Landiras fires are clearly visible, along with many smaller burn scars:

By partitioning burned area data according to administrative boundaries, we calculate the annual area burned within each territorial unit. This unit can be a municipality, a ZIP code, a district, or any other local administrative division, depending on the country or use case. For this demonstration, we apply the methodology to the particularly complex French system, which includes over 30,000 municipalities.
Using the annual burned area per administrative unit, we then compute a long-term average to quantify historical wildfire incidence at the local level.
While we use the mean in this example it is sensitive to extreme events. In some cases, a single large wildfire may dominate the average and obscure the impact of more frequent but smaller fires. In large territories or datasets with diverse fire patterns, computing the median annual burned percentage can provide a complementary perspective.
For example, in southwestern France, the communes of Guillos and Origne were severely affected by the 2022 Landiras fire, which burned 75 percent of their territory. Yet, they recorded no other fires between 2008 and 2024. This raises the question of whether they are truly more exposed than other areas experiencing repeated smaller incidents.
Finally, to account for differences in size, we divide the average annual burned area by the total surface of each administrative unit. This normalization step ensures that our metric reflects the proportion of territory affected by wildfires rather than absolute area alone.
Use Case: Results from France Highlight Uneven Exposure
We performed this analysis on the French territory using municipalities as the territorial unit.
As expected, our analysis shows wide geographical variation in wildfire exposure across France. Only 691 municipalities (roughly 2 percent of the total) experienced more than 0.1 percent of their territory burned annually, on average. In 173 municipalities, the annual median exceeds 1 percent.
Interestingly, the most fire-prone municipalities are not in southern Provence or the Mediterranean coast, but rather in the Western Pyrenean foothills. Of the 20 most affected municipalities in our analysis, 15 are in the Pyrénées-Atlantiques. The most exposed municipality is Estérençuby, also located in the Pyrénées-Atlantiques: since 2008, it has experienced wildfires in roughly half the years, with an average of over 8 percent of its land area burned per year.
This interactive map allows to explore the results for each French municipality:
A Method with Global Applications
The same methodology can be applied to many other countries and regions. Burned area data are available from EFFIS for Europe, the Middle East and North Africa, and similar data can be obtained globally from other sources, like the Global Wildfire Information System.
At Callendar, this local wildfire risk indicator is integrated into our broader Diagnostic d'Exposition Climatique (Climate Exposure Diagnostic), a tool that assesses current and future climate risks at the level of individual addresses. The DEC includes both past hazard records (from disaster declarations or in the case of wildfire satellite proxies) and forward-looking projections based on climate models.
Beyond this product, this methodology can support a range of actors:
Municipalities and regional governments preparing climate vulnerability assessments
Insurers building zonal risk models for home and property coverage
Grid operators and utility companies seeking to monitor infrastructure exposure to fire risk
For example, California's January 2025 wildfires near Los Angeles affected over 15,000 hectares, with repeat fire events in some neighborhoods in recent years. Applying this method to southern California could reveal the most at-risk zip codes and support infrastructure planning, insurance modeling, or fire prevention strategies.
Whether in France, California, or North Africa, Callendar's methodology and tools enables public and private stakeholders to make informed, location-specific decisions in the face of a changing climate.
For more information, contact the Callendar team or explore our other climate risks studies and use cases.